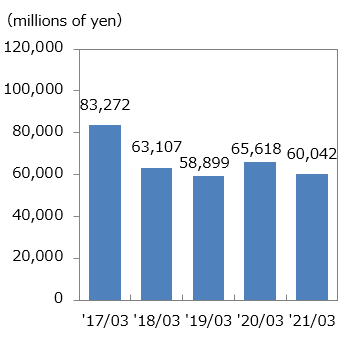
Net Sales
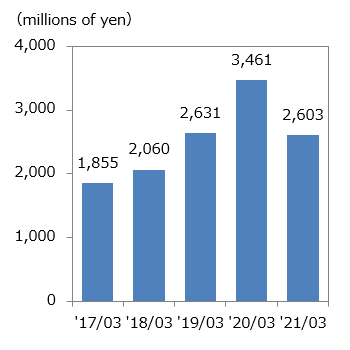
Operating Income
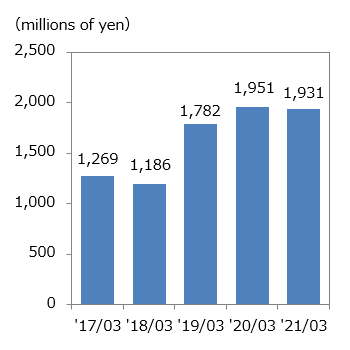
Profit attributable to owners of parent
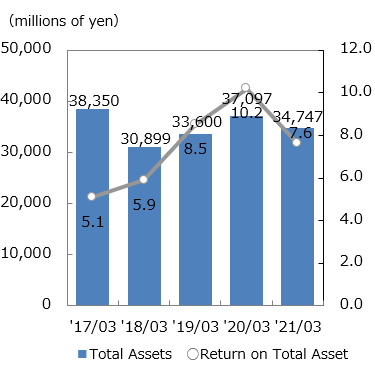
Total Assets, Ordinary Income
to Total Assets Ratio
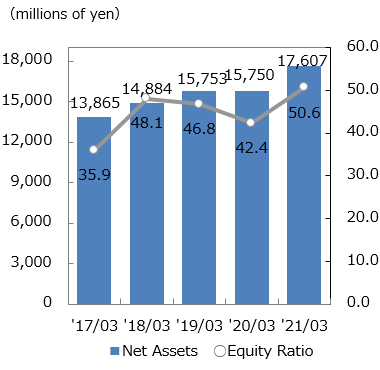
Net Assets, Equity Ratio
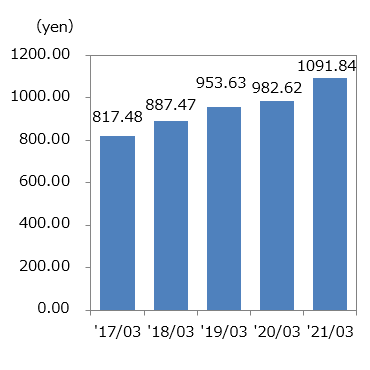
Net Assets per share
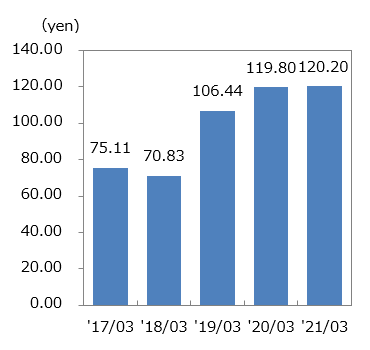
Net Income per share
| '17/03 | '18/03 | '19/03 | '20/03 | '21/03 | |
|---|---|---|---|---|---|
| Net Sales | 83,272 | 63,107 | 58,899 | 65,618 | 60,042 |
| Operating Income | 1,855 | 2,060 | 2,631 | 3,461 | 2,603 |
| Profit attributable to owners of parent | 1,269 | 1,186 | 1,782 | 1,951 | 1,931 |
| Total Assets | 38,350 | 30,899 | 33,600 | 37,097 | 34,747 |
| Ordinary Income to Total Assets Ratio(%) | 5.1 | 5.9 | 8.5 | 10.2 | 7.6 |
| Net Assets | 13,865 | 14,884 | 15,753 | 15,750 | 17,607 |
| Equity Ratio (%) | 35.9 | 48.1 | 46.8 | 42.4 | 50.6 |
| Return on Equity(%) | 9.6 | 8.3 | 11.6 | 12.4 |
11.6 |
| Net Assets Per Share | 817.48 | 887.47 | 953.63 | 982.62 | 1091.84 |
| Net Income Per Share | 75.11 | 70.83 | 106.44 | 119.80 |
120.20 |